For the complete documentation index, see llms.txt. This page is also available as Markdown.

Migrating from Data Connector 1.0

If you are migrating from the previous version of Data Connector, this section is for you.

Motivation

We are constantly improving our Enterprise reporting to gain insights and make tracking your users' progress on our platform even more straightforward.

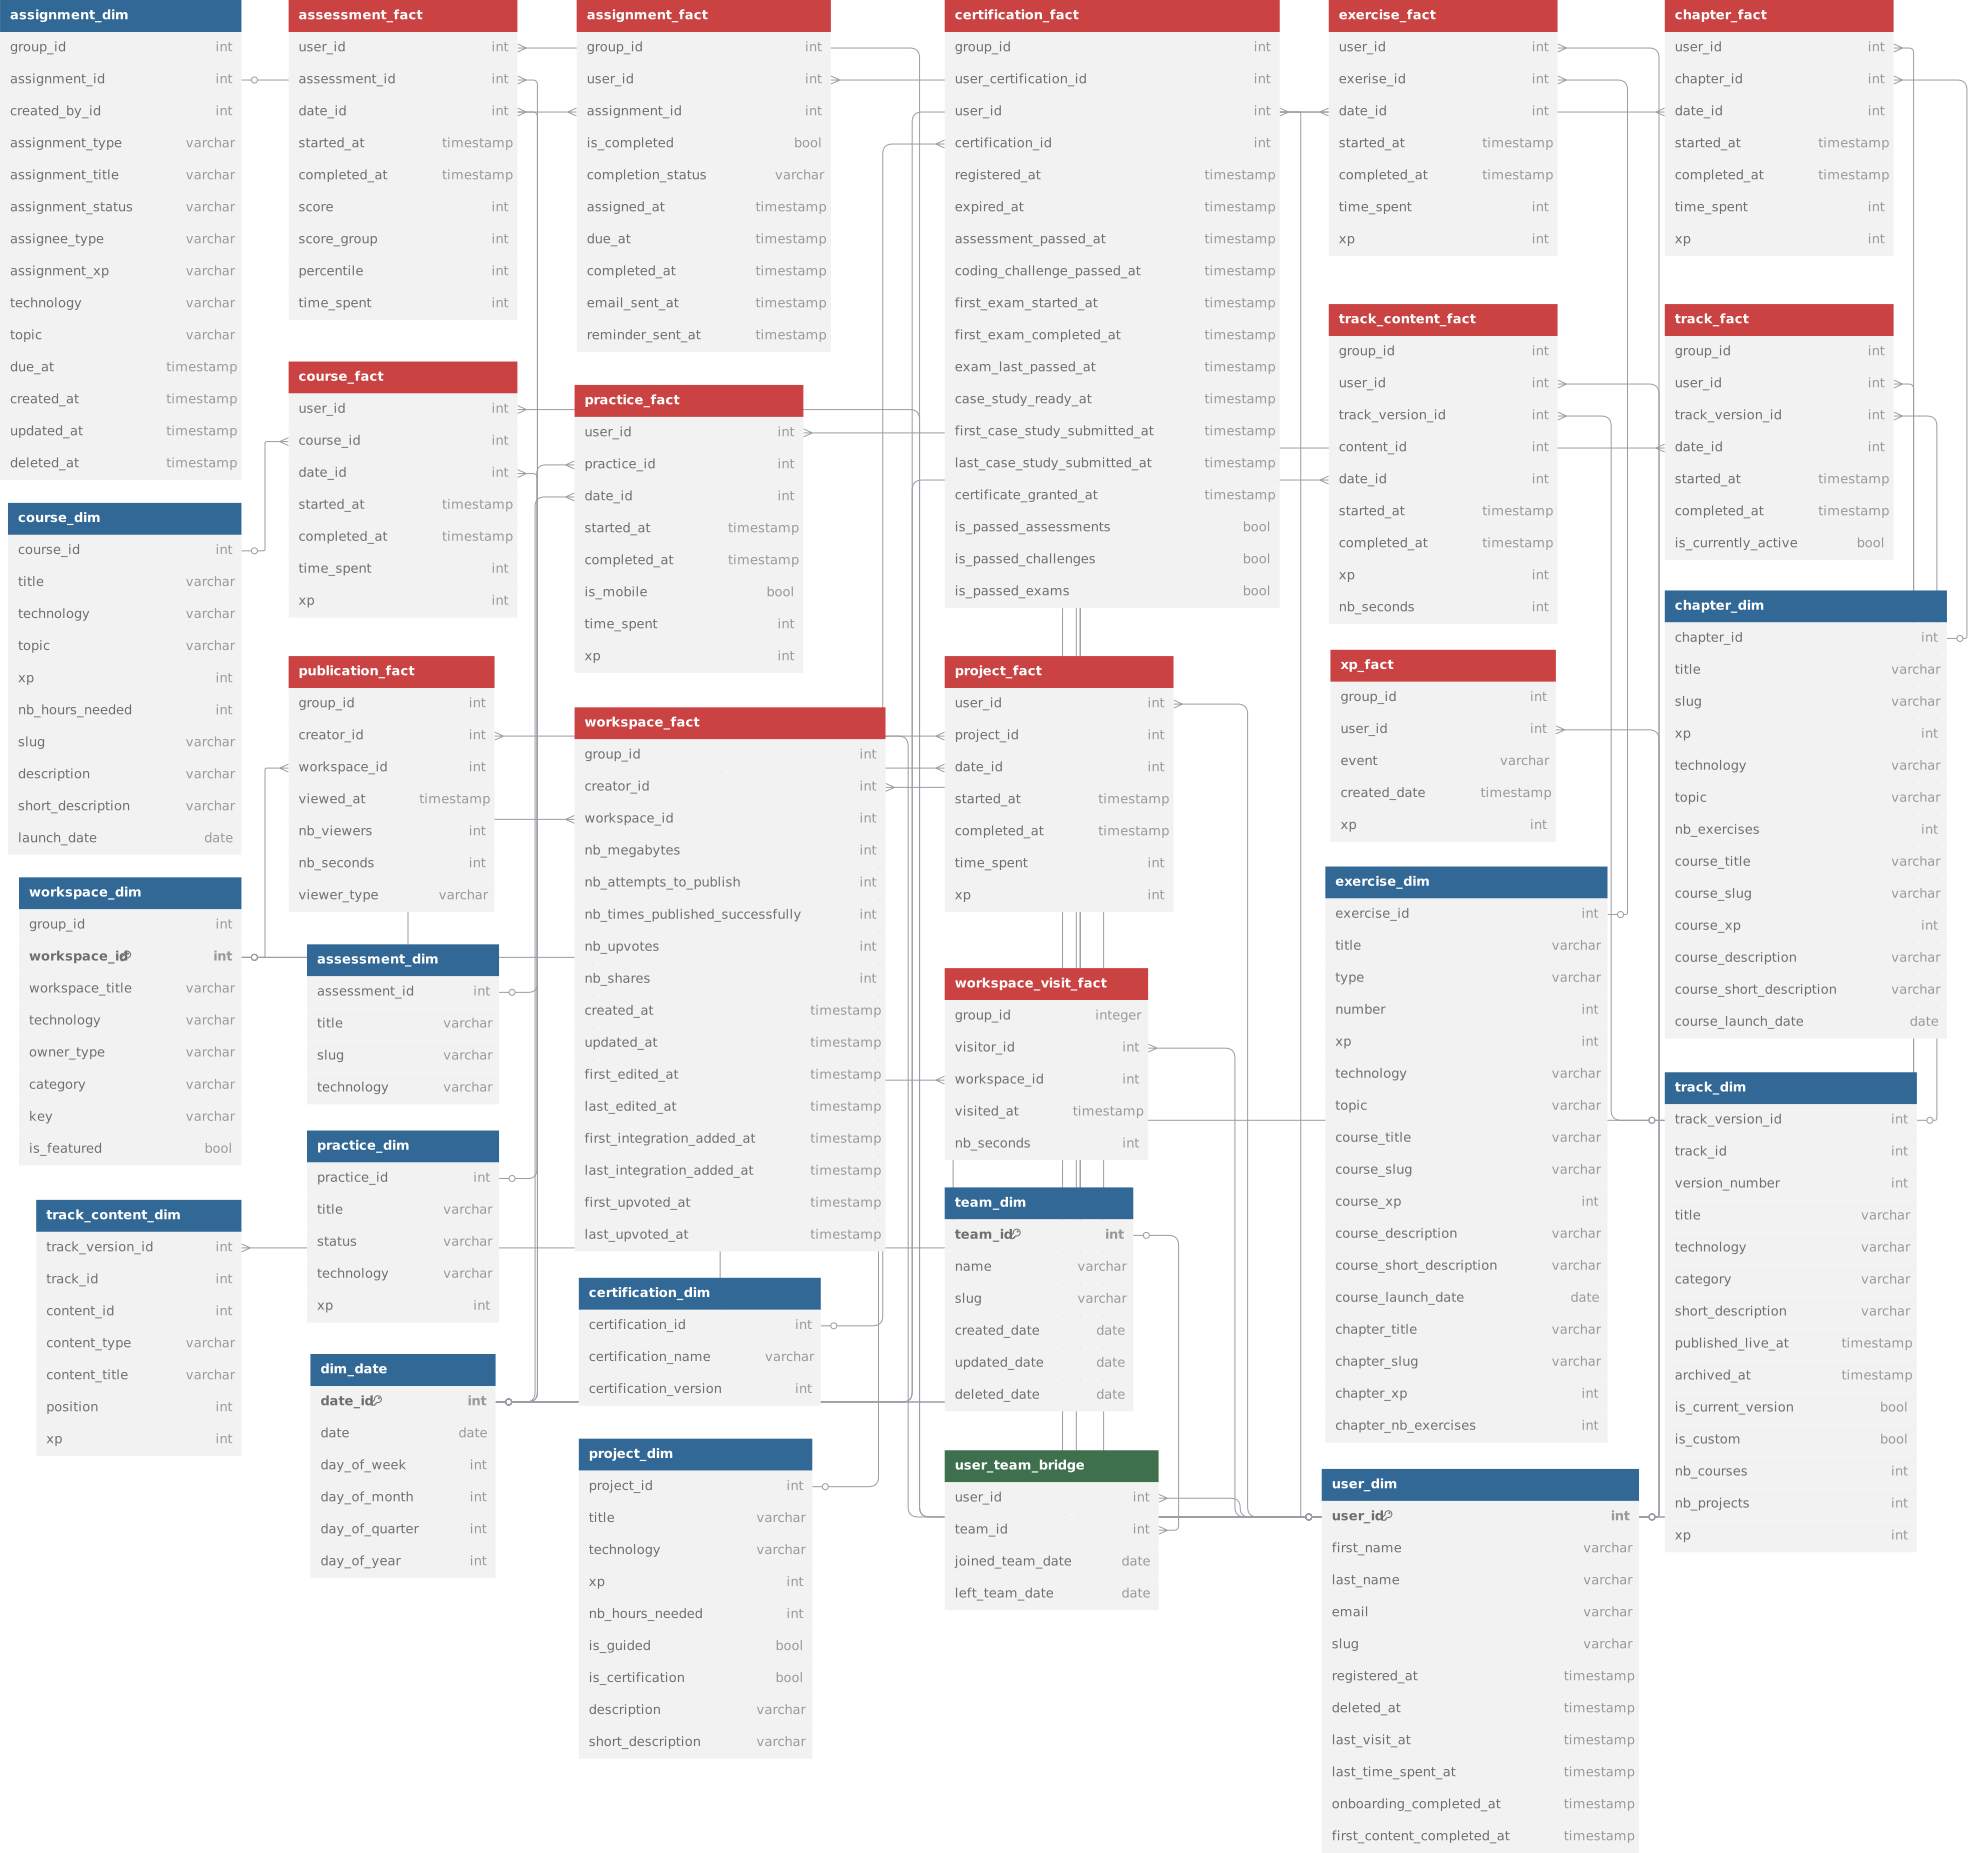
The main change in Data Connector 2.0 is the data model. It is organized around core fact, dimension, and bridge tables, with metric tables for common reporting use cases.

This structure makes the data easier to query, adds mobile usage data, and makes it easier to build dashboards using your organization's BI tools.

Additionally, by moving to this improved data model, Data Connector now uses the same data as the rest of our Enterprise reporting. This allows for faster iteration and ensures that every report matches everywhere.

What is changing?

Data Model

In version 1.0, we had a robust data model allowing a lot of granularity and detail. The downside is that it had a steeper learning curve.

We have simplified the model, going from this:

Data Connector 1.0 Data Model

To the model shown in the Data Connector 2.0 ERD.

Finding the correct table for your queries is now quicker and easier. Data Connector 2.0 exposes the core event model through fact, dimension, and bridge tables, and provides metric tables for common reporting use cases.

Improvements

Data Connector 2.0 now exposes 16 core fact, dimension, and bridge tables, plus 4 metric tables for common reporting use cases. It also includes mobile usage data and uses the same reporting source as the rest of Enterprise reporting.

Data Connector 1.0
Data Connector 2.0

Core fact, dimension, and bridge tables

29 mart tables

16 tables

Metric tables

0

4

Mobile data

No

Yes

Common reporting queries

Usually require multiple joins

Often use one metric table or one fact table

Enterprise reporting consistency

No

Yes

Sample queries (1.0 vs. 2.0)

Comparing the SQL code required to answer the same question on both data models illustrates why we decided to change.

For example, let's calculate the total time in Learn content (assessments, courses, practices, and projects) between January 15 and February 14, 2025.

On Data Connector 1.0, you needed to do this:

The granularity built into the model made it harder to answer more general questions that are frequently asked.

With Data Connector 2.0's model, the same question can be answered with the following query:

What do I need to do to switch?

Data Connector 2.0 still uses AWS S3 buckets to hold your organization's data, so connecting to the new version is straightforward.

For more details, please refer to our Getting started with Data Connector and Using Data Connector sections.

Last updated